Showing this month will be: Karthik Pandian
http://blog.art21.org/2010/01/18/new-guest-blogger-karthik-pandian/
"Thanks to Joel Holmberg for guest blogging this last fortnight. Up next is Karthik Pandian. Karthik is an artist and writer based in Los Angeles. He is represented by Richard Telles Fine Art and has contributed essays to Bidoun and Motherwell. While his work may best be described as 16mm film installation, his practice follows in the footsteps of such diverse figures as Imhotep, Steve Wynn, Carmen Sandiego, Ole Worm, and Benjamin Franklin Gates. He is currently working on a solo exhibition slated to open at Midway Contemporary in Minneapolis in September 2010, but hopes one day to reopen the Musée de l’Homme on the Pacific Trash Vortex, where he will serve as Curator of Ruins and IMAX 3D projectionist."
Monday, August 30, 2010
3 ways that design makes you happy
Don Norman on 3 ways good design makes you happy
http://www.ted.com/talks/don_norman_on_design_and_emotion.htmlDon Norman: Cognitive scientist and design critic
taken from the site: http://www.ted.com/speakers/don_norman.html

Norman began his career as an academic, working in psychology and then cognitive science at UCSD. In the mid-'90s, he joined Apple and ended up in their Advanced Technology Group, and later worked for HP, before returning to university life. He's now the co-director of an innovative combined MBA and MEM program (called MMM) at Northwestern University. He's also a cofounder of the usability consultancy Nielsen Norman Group.
"Dr. Norman, a cognitive scientist who is a professor at Northwestern, has been the maestro of gizmos since publishing 'The Design of Everyday Things,' his 1988 critique of VCRs no one could program, doors that couldn't be opened without instructions and other technologies that seemed designed to drive humans crazy."John Tierney, the New York Times"
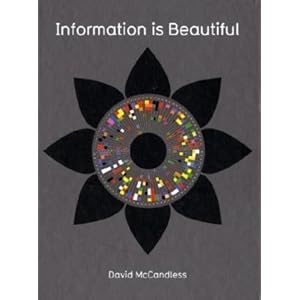
The beauty of visulizing data: David McCandless
David McCandless: The beauty of data visualization
http://www.ted.com/talks/david_mccandless_the_beauty_of_data_visualization
Taken from Ted Talks
His website: http://www.informationisbeautiful.net/
Books:
The Visual Miscellaneum: A Colorful Guide to the World's Most Consequential Trivia [Paperback]
David McCandlessDavid McCandless (Author)
Find all the books, read about the author, and more.
See search results for this author
Are you an author? Learn about Author Central
| ||
-----------------------------------------------------------------------
Bio taken from: http://www.ted.com/speakers/david_mccandless.html
 David McCandless: Data journalist
David McCandless makes infographics -- simple, elegant ways to see information that might be too complex or too big, small, abstract or scattered to otherwise be grasped. In his new book, Information Is Beautiful (in the US, it's being called The Visual Miscellaneum), McCandless and his cadre of info designers take a spin through the world of visualized data, from hard stats on politics and climate to daffy but no less important trends in pop music. McCandless' genius is not so much in finding jazzy new ways to show data -- the actual graphics aren't the real innovation here -- as in finding fresh ways to combine datasets to let them ping and prod each other. Reporting the number of drug deaths in the UK every year is interesting; but mapping that data onto the number of drug deaths reported by the UK press, broken down by drug, is utterly fascinating (more deaths by marijuana were reported than in fact occurred, by a factor of 484%). McCandless contributes a monthly big-think graphic to the Guardian's Data Blog, and makes viral graphics for his blog Information Is Beautiful.
"It's not just the sheer variety of topics covered -- though knowing the relative effect of rising sea levels or the prime vintage years for red and white wines by country will come in handy someday soon, I'm certain -- but the way in which, for many of these charts, there's considerably more than meets the eye."Chris Bilton, Eye Weekly review of The Visual Miscellaneum"
Sunday, August 29, 2010
Subscribe to:
Posts (Atom)


